Commonly requested facts, statistics and figures about Christchurch City.
- Archaeological evidence suggests Christchurch was first settled by moa-hunting tribes as early as AD 1000.
- The Māori name for Christchurch is Ōtautahi. The name is derived from a Ngai Tahu chief, Tautahi, who along with his people, had settlements on the riverbanks of the Ōtākaro-Avon River.
- Planning of the Christchurch settlement began in England in the late 1840s, named after the college at Oxford University that key founder John Godley attended. It was planned as a model Anglican church settlement, intending to replicate a typical English community. It was established as a colony in 1850.
- Christchurch became New Zealand’s first city by Royal Charter in 1856.
- Christchurch city's most recent population estimate was 419,200, at June 2025.
- The 2010/2011 earthquakes resulted in a net loss of around 21,000 people, but by 2017 the city's population had recovered to pre-earthquake levels.
- Based on the current Long Term Plan 2024-2034(external link) projection series starting in 2018, the last six years has seen higher than anticipated growth.
- Projections suggest that by 2034 the city's population could be around 433,000; by 2044 it could be around 456,000; and by 2054 it could be around 475,000.
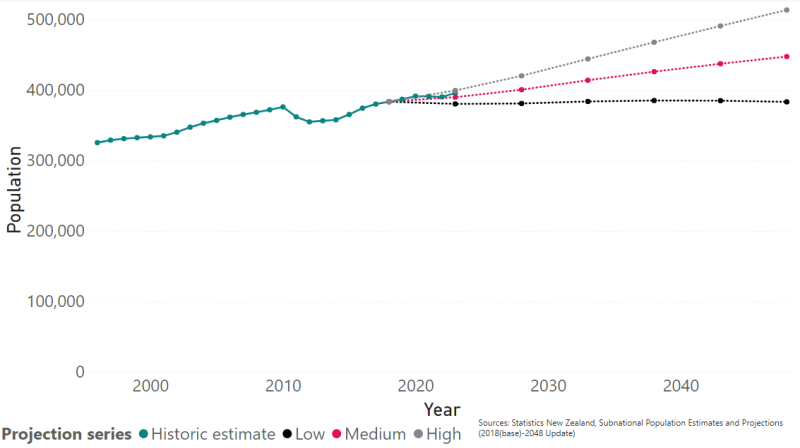
Population estimates and customised LTP projections for Christchurch City (2018-base)
Surrounding districts
- Neighbouring Selwyn and Waimakariri districts had an estimated combined population of 157,400 at June 2025.
- Longer term, under a medium growth scenario, the population is expected to be around 200,000 by 2038 and around 250,000 by 2053.
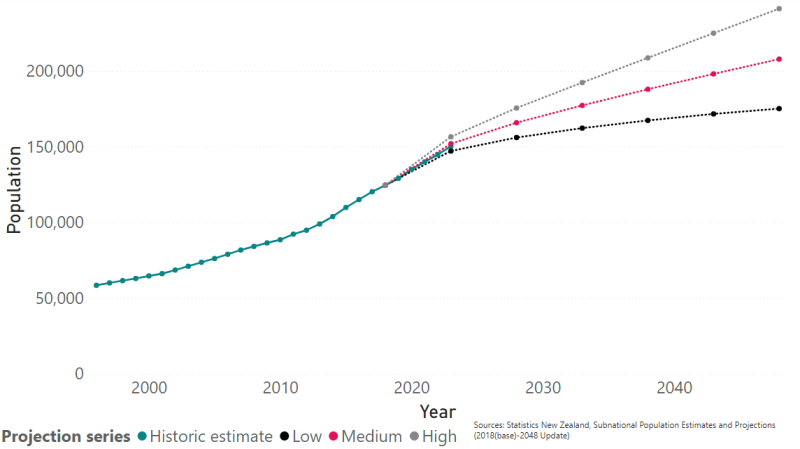
Population estimates and projections for Selwyn and Waimakariri Districts (2023-base)
Life-cycle age groups
- The city's estimated median age was 37.6 years in 2023.
- The number of older people aged 65 years and over is expected to increase by 68% between 2023 and 2053 from 65,400 to 110,000. As a proportion of the city's population, this age group will likely increase from 16% to 22% between 2023 and 2053.
- The number of people aged under 15 years is expected to slightly increase between 2023 and 2053, from 67,400 to 68,400. As a proportion of the city's population, this age group will likely decrease from 17% to 13%.
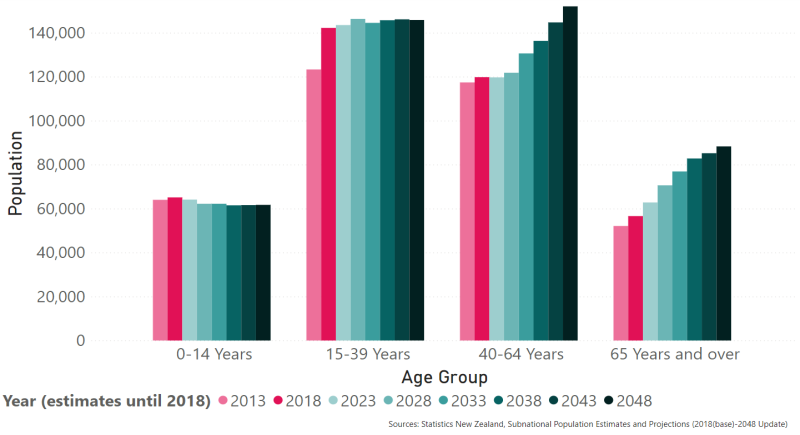
Age group estimates and projections (2023-base)
Ethnic groups
- In 2023, 13% of the city's population indicated they had Māori descent (49,700 people).
- The most common ethnicities in the city that people identified as were European (76%), Asian (17%), Māori (11%), Pacific Peoples (4.3%), and Middle Eastern/Latin American/African (1.9 %).
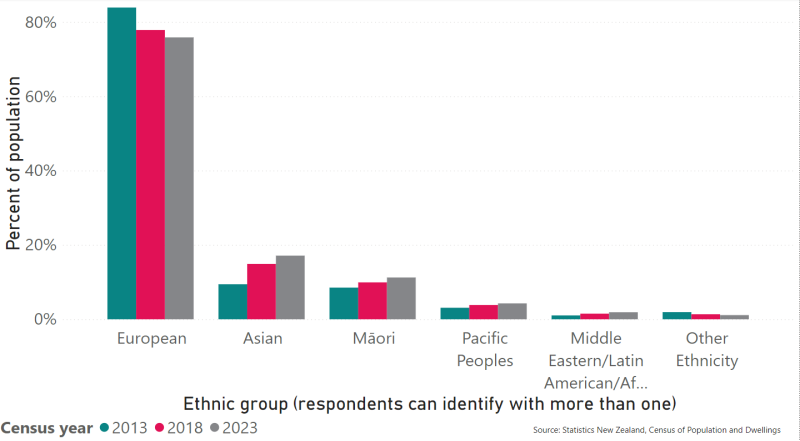
Ethnicity
Note: Includes all people who stated each ethnic group, whether as their only ethnic group or as one of several. Where a person reported more than one ethnic group, they have been counted in each applicable group. As a result percentages do not add up to 100. Ethnicity data from the 2023 Census was published as part of the first release of data in May 2024.
Birthplace
- In 2023, 28% of the city's residents were born overseas.
- Of the residents who were born overseas, 46% were from Asia and 21% were from the United Kingdom and Ireland.
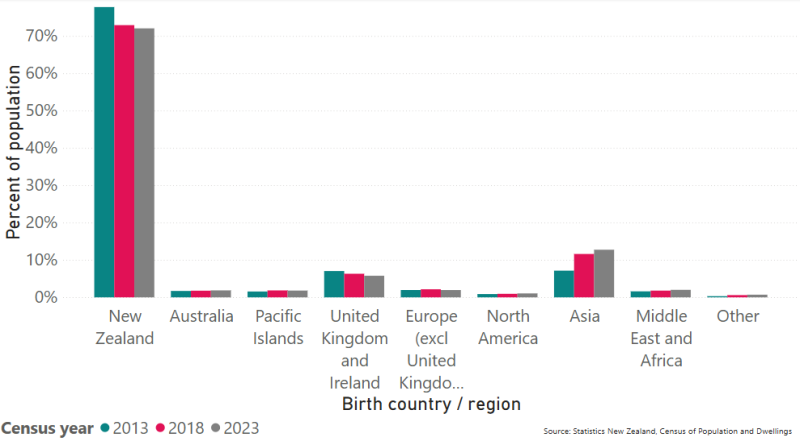
Birth region 2023
Religion
- 55% of residents report not being affiliated with any religion.
- The city's most common religions were Christian (32% of residents), Hinduism (2.1%) and Islam (1.3%).
Business and employment
- In February 2025, around 48,200 businesses employed 238,000 people.
- The largest industry by number of businesses was Rental, Hiring and Real Estate Services, which made up 21% of all Christchurch businesses.
- The top five industries by number of employees were:
- Health Care and Social Assistance (33,300 employees)
- Retail Trade (23,000 employees)
- Manufacturing (22,100 employees)
- Professional, Scientific and Technical Services (22,100 employees)
- Construction (20,800 employees)
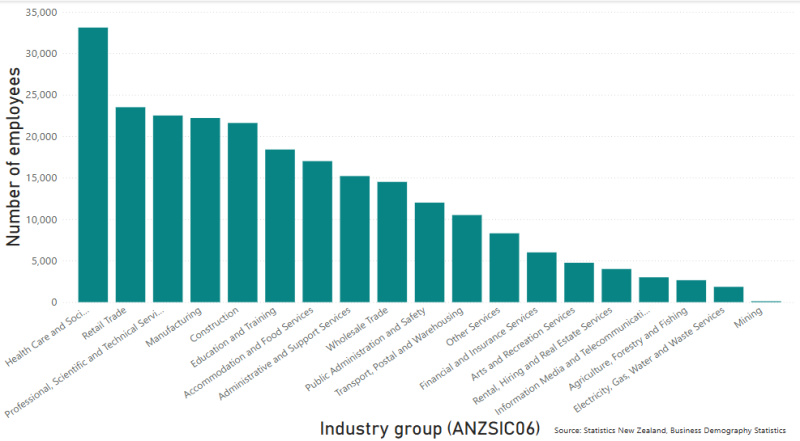
Employment by sector 2025
Gross domestic product (GDP)
- The city had a GDP of $36.6 billion in the year to March 2025. This was a decrease of $564 million (-0.3%) from 2024.
- Three industries accounted for almost 30% of the city's GDP in 2024: Professional, Scientific and Technical Services (12%); Healthcare and Social Assistance (9%); and Manufacturing (8%).
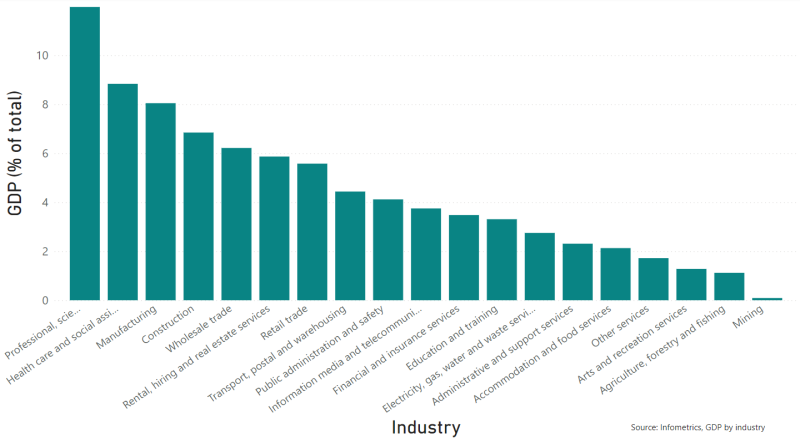
Gross Domestic Product contribution by industry 2024 (one year lag)
City spending
- Electronic card retail spending was estimated at $6.85 billion in Christchurch City for 2025 (excludes cash and online transactions).
- 71% of this spending was made by Christchurch City residents.
- 24% was made from residents living elsewhere in New Zealand.
- 5% was made by international card holders.
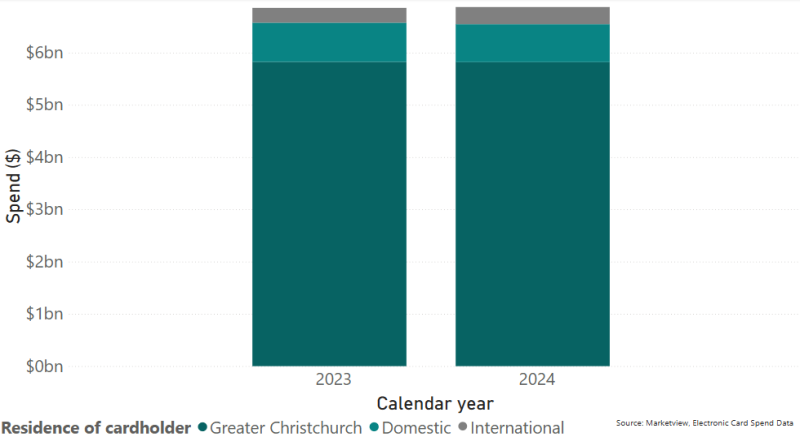
Electronic card spending in Christchurch City
Commercial centre spending
- Between 18% and 20% of all citywide retail spending is concentrated in the central city.
- The suburban centres with the highest amount of retail spending are Papanui, Hornby and Riccarton.
Zoned land
Christchurch City has around 141,550 hectares of land area, based on Statistics New Zealand's geographic boundaries.
- Around 70% of the city's zoned land is located in Banks Peninsula.
- In terms of land use, 8% is zoned as residential, 92% is non-residential, and 0.01% is zoned as mixed-use.
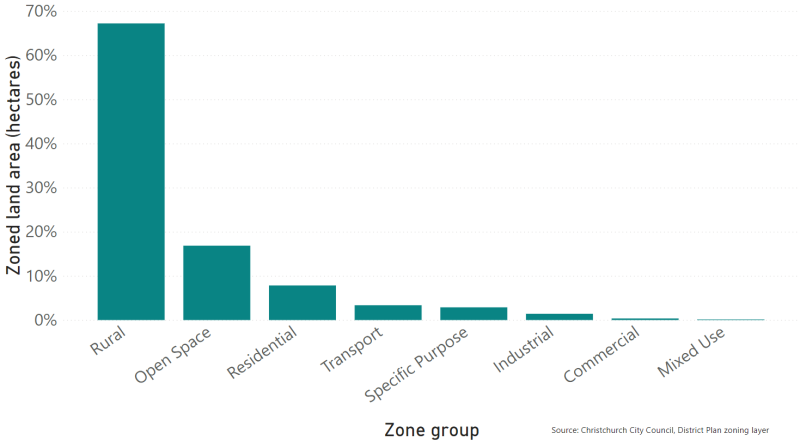
Zoned land as of May 2025
Income and Deprivation
- In 2025, the mean household income was $116,923 which was lower than the national mean ($135,266).
- In 2023, 22% of our residents lived in areas with the lowest socioeconomic deprivation scores (deciles 1 and 2) and 16% lived in areas with the highest deprivation scores (deciles 9 and 10).
- In general, areas on or near the Port Hills had the lowest levels of socio-economic deprivation. Pockets of low-level deprivation were also found in the inner north-west suburbs, and in some of the newer developments on the outskirts of the city.
- In general, eastern areas of the city had the highest levels of socio-economic deprivation. Other pockets were distributed throughout the city.
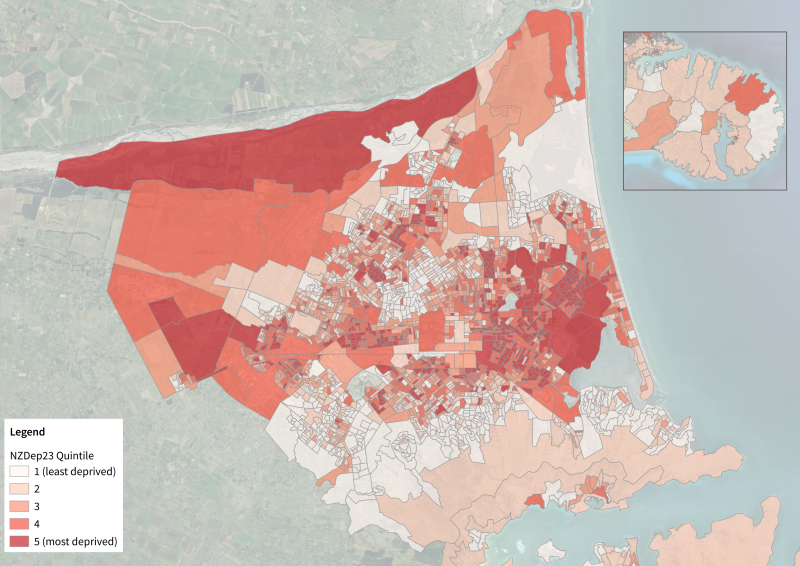
Deprivation Index 2023
- View interactive map down to street block level(external link)(external link) (Massey University)
The 2023 deprivation index(external link)(external link) was developed by researchers at the University of Otago, and combines nine variables from the 2023 census which reflect dimensions of socio-economic deprivation. NZDep2023 provides a deprivation score for each meshblock in New Zealand (a meshblock is generally the size of a street block in urban areas, containing approximately 30-60 dwellings). Deprivation scores apply to areas rather than individual people.
Households and dwellings
- In 2023, 73% of dwellings were separate houses and 26% were joined dwellings (e.g. units or apartments).
- In 2023, there were 149,450 households in private occupied dwellings in Christchurch City. Around two-thirds (67%) of these were family households, and just over one quarter (26%) were one-person households.
- Projections suggest the total number of households will likely increase to around 167,200 by 2033 (medium series) and 176,400 households by 2043.
- In 2023, the city's average household size was 2.5 people per household.
Housing development
- Building consents were issued for 3,700 new dwellings and units for the year ending December 2025.
- Of these, 3,100 were for additional dwellings and units to the city's housing stock (net new housing/housing gain).
- The remaining 600 were replacing dwellings which had been demolished.
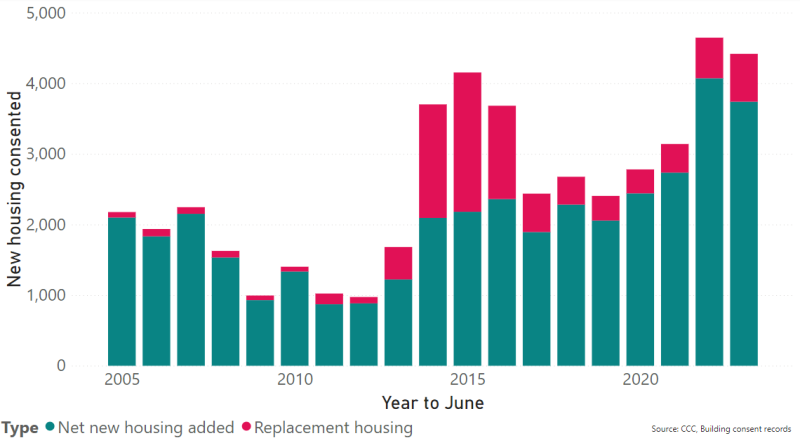
Net new housing
New housing refers to additional housing added to the city's current housing stock. It excludes replacement housing (i.e. when a dwelling is demolished and replaced with a single dwelling).
Housing costs
- The median house sale price for Christchurch City was $725,000 in December 2025. Sale prices increased sharply between 2020 and early 2022.
- The average weekly rent in Christchurch was $517 for the year to March 2025. This was an annual increase of 4% from 2024, when it was $499.
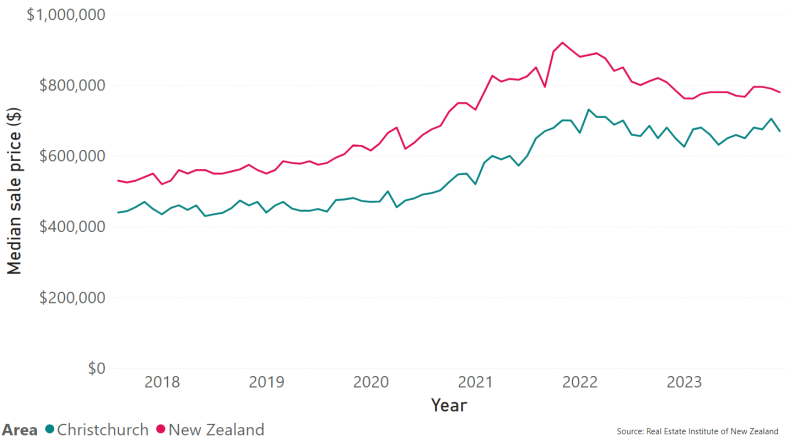
Median house sale price in Christchurch City
Number of motor vehicles
- In 2023, 7% of Christchurch households did not have a motor vehicle.
- 74% of Christchurch households had one or two motor vehicles.
Travel to work
- In 2023, the most common modes of transport to work were: driving a private car, truck or van (59%); driving a company car, truck or van (10%); and bicycle (6%). Around 13% of Christchurch residents usually worked from home.
Travel to work (usual means)
Information about how we're going at delivering our goals of a prosperous, vibrant, liveable central Christchurch can be found on our tracking the progress of our Central City.
Topics include population, business and employment, spending data, visitor activity and perceptions around the central city.
These fact sheets contain a range of indicators to track the progress of each centre.
Further information
- Comprehensive information for Christchurch City and its suburbs is available on Statistics New Zealand’s 2023 Census Place Summaries(external link). Topics include population, ethnicity, religion, health, employment, income, education, and housing.
- Information about census variables used in these profiles, including definitions and data quality ratings, can be found at Stats NZ(external link).
Request stats, facts and information

Terms of use
- Christchurch City refers to the area governed by the Christchurch City Council.
- These pages complement the information found within the Council's Community Outcomes programme, which measures progress towards achieving the strategic directions of the organisation.
- Every effort has been made to ensure accuracy in processing, analysing and reporting the information provided in these web pages and reports. However, the Christchurch City Council gives no warranty that the information in these web pages and reports contains no errors.
- The Council shall not be liable for any loss or damage suffered consequent upon the use directly, or indirectly, of the information supplied in this publication.